An image to audio spectrogram tool sounds like it should turn a picture back into a song, but a spectrogram image is not the same thing as an audio file. It can guide creative sonification and rough reconstruction, yet it usually lacks the phase, resolution, scale, and context needed for accurate repair.
A spectrogram image is a map, not the territory
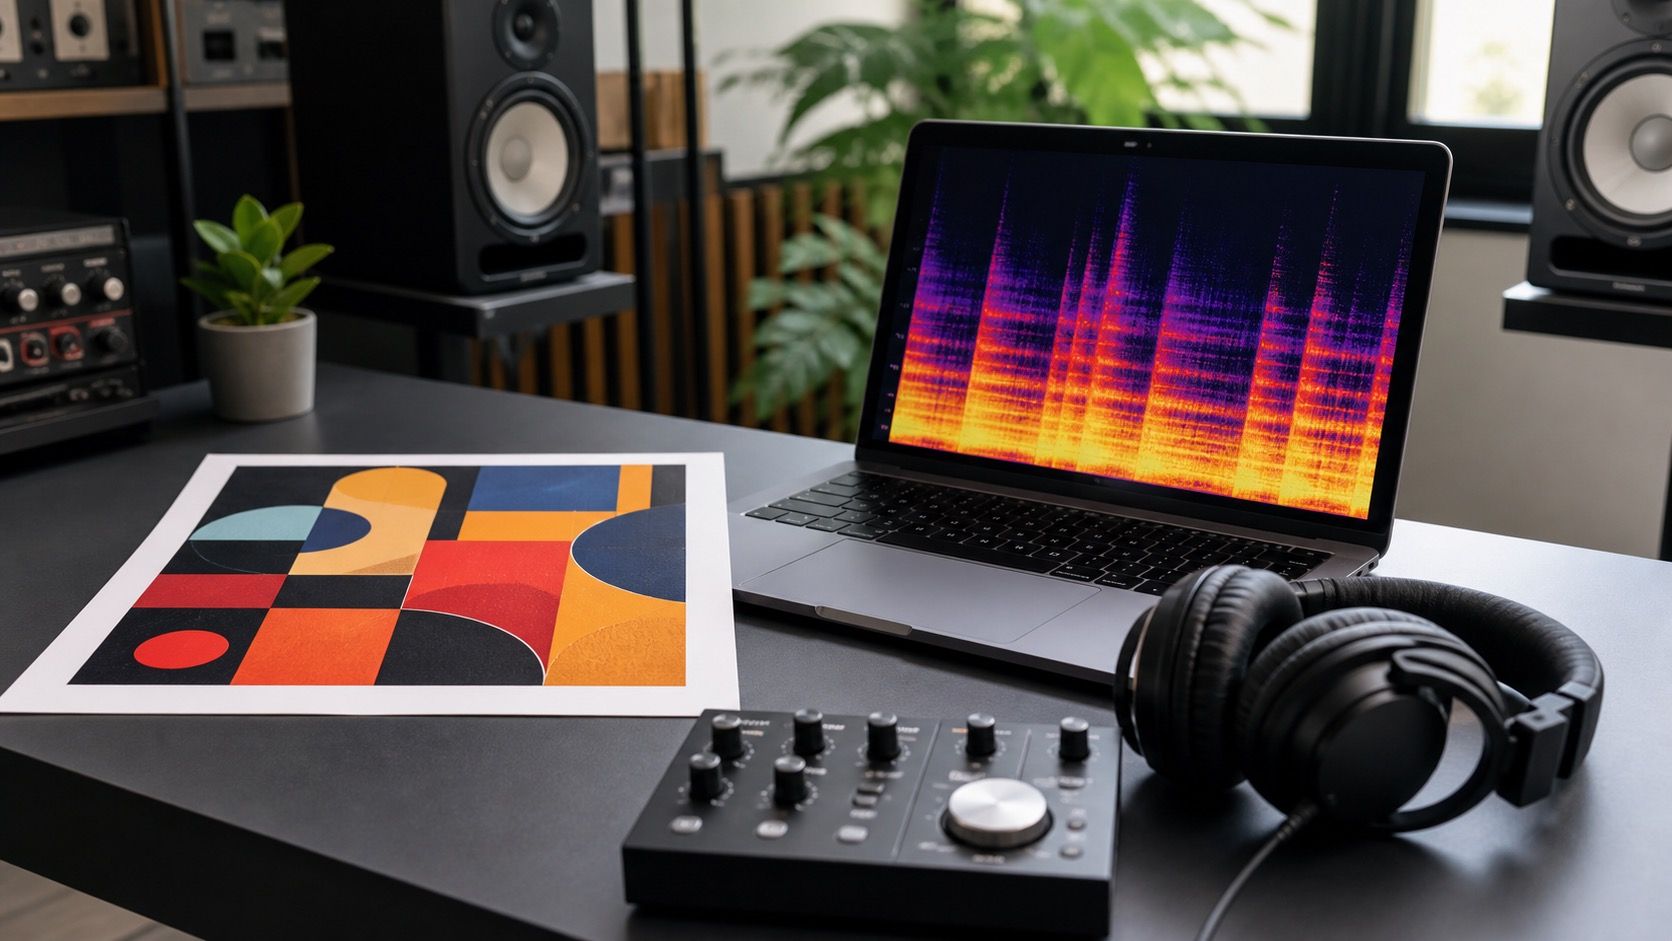
A normal audio file stores a changing waveform. A spectrogram is a visual interpretation of that waveform after analysis. It divides sound into time slices and frequency bins, then paints energy as brightness or color. When you save that display as a PNG or JPG, you are saving the map. You are not saving every microscopic detail that the original audio engine used to draw it.
This is why the phrase image to audio spectrogram can be confusing. Some people mean turning audio into a spectrogram image. Others mean using a spectrogram image to synthesize sound. The second task is possible in a limited way, but it is closer to reconstruction than conversion. The tool tries to infer a sound that would produce something like the image. It does not simply unpack hidden audio from the picture.
The difference matters when someone expects a converter to recover a lost WAV from a screenshot. A screenshot may be resized, compressed, cropped, color graded, or missing the axis labels. Even a clean spectrogram export may have a chosen frequency ceiling and a chosen color scale. Those choices shape the visible result. Once the original data is flattened into pixels, the converter has to guess.
The missing piece is phase information
The biggest technical gap is phase. A spectrogram image usually shows magnitude: how much energy exists at each frequency over time. It normally does not show the phase relationships that help rebuild the exact waveform. Two sounds can share a similar magnitude display while feeling different in transients, stereo image, and texture. That is one reason reconstructed audio often sounds watery, smeared, or synthetic.
Fourier transform analysis can be reversed when the needed data is preserved. A plain image does not preserve it all. Reconstruction methods may estimate phase by iteration, borrow assumptions from neighboring frames, or synthesize tones from brightness. These methods can be clever, but they cannot know what the original file knew. If a snare transient was represented by a few bright vertical pixels, the exact crack and body of that snare are gone.
| What the image may show | What may be missing | Effect on reconstruction |
|---|---|---|
| Frequency energy | Precise phase relationships | Audio can sound smeared or hollow |
| Time position | Sub-frame transient detail | Clicks and drums may lose impact |
| Color brightness | Original amplitude scale | Loudness and balance can be guessed wrong |
| Visible frequency range | Content outside the cropped view | Low rumble or high air may disappear |
That is also why clean-looking spectrogram art can produce rough audio. The image may have smooth gradients that look musical, but the converter still has to choose how those gradients become wave cycles. In creative work that uncertainty can be fun. In repair work it is a serious limitation.
Creative use is different from restoration
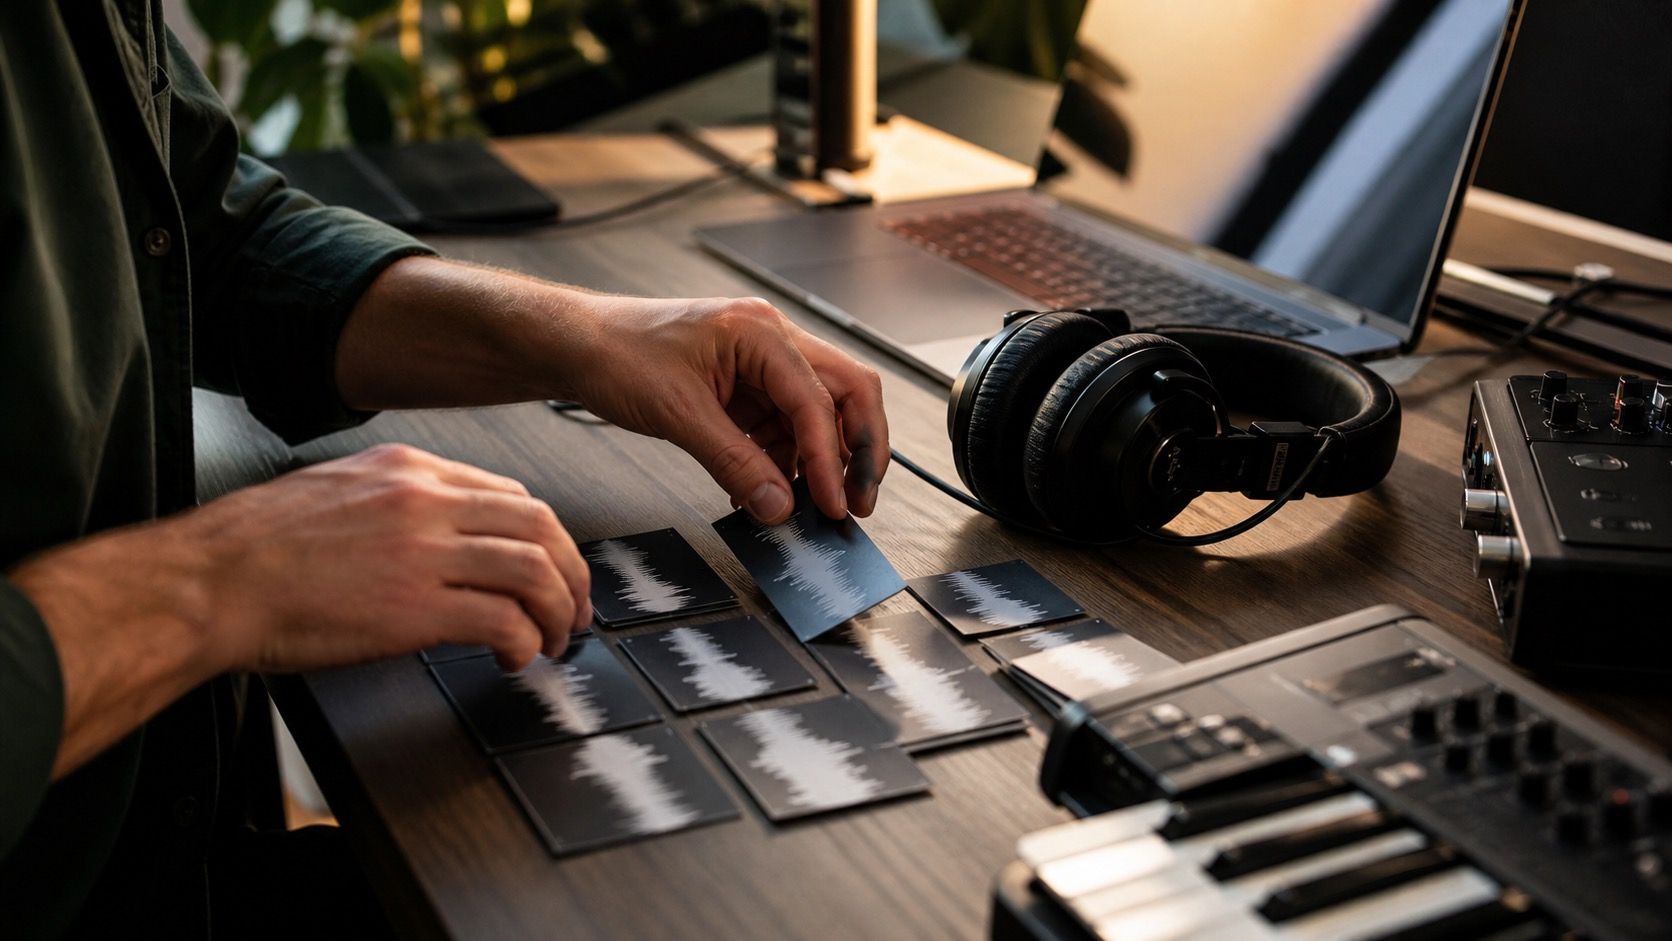
There is a legitimate creative use for image to audio spectrogram tools. Artists have hidden shapes, logos, and patterns inside sound for years by drawing frequency energy that appears when viewed as a spectrogram. In that context, the strange sound is part of the effect. You are not trying to restore a natural vocal or a finished master. You are using the frequency display as a composition surface.
For AI music makers, this can be useful as a learning exercise. Draw a few bright horizontal bands and listen to how steady tones appear. Draw vertical blocks and hear how percussive events behave. Push the top band and notice how easily it becomes harsh. This kind of sonification teaches the relationship between visual energy and audible texture better than a paragraph of theory.
Restoration is another matter. If you have a damaged AI song, a screenshot of its spectrogram is not a substitute for the audio file. If you want to remove shimmer, hum, or broadband noise, work from WAV, FLAC, or the best export you still have. Use the spectrogram image to identify the problem, then repair the actual audio. Trying to convert spectrogram to audio from an image of the damaged file adds a second layer of uncertainty before the repair even starts.
Converter results can be misleading
An image to audio spectrogram converter online may accept an uploaded image and return a sound quickly. The speed is convenient, but the result can trick you if you do not know what the tool assumed. It may map pixel height to frequency linearly or logarithmically. It may treat dark pixels as silence or low energy. It may ignore the color hue and use brightness only. It may stretch the image to a fixed duration. Each assumption changes the sound.
Image compression can add another problem. A JPG spectrogram often contains block artifacts, soft edges, and color noise. A converter can interpret those pixels as audio energy. The output may include hiss, buzzing, or little chirps that never existed in the source. A resized screenshot can also shift frequency bins, so a line that looked like a steady tone may return slightly wrong or unstable.
If you are experimenting, prepare the image deliberately. Use a high-resolution PNG, avoid text labels inside the sound area, keep the axes uncropped if the tool needs them, and test with a simple pattern first. If a clean horizontal stripe does not return a stable tone, the converter is not reliable enough for subtle work. That small test saves you from trusting a dramatic result on a complicated full-song image.
Better ways to inspect an audio file
When the goal is quality control, start with the audio file, not a spectrogram image. Open the WAV, FLAC, or original export in an editor that can display a spectrogram directly. That keeps the analysis tied to real audio samples instead of pixels. You can zoom, change window size, adjust the frequency ceiling, and compare channels without losing the underlying data.
For AI music exports, direct inspection gives better answers. A metallic vocal edge may appear as moving high-frequency spray around consonants. A low hum may show as thin horizontal lines. A bad denoise pass may leave holes, gates, or smeared tails between phrases. These patterns are easier to interpret when you can play the exact timestamp and switch between waveform, spectrogram, and listening.
Use image-based conversion when the point is education, sound design, or deliberate spectral art. Use audio-based analysis when the point is repair, mastering, or release checks. The boundary is simple: if the decision affects a finished song, keep the real audio in the chain. A spectrogram image can help you see, but it should not become the master copy of what you hear.
The honest expectation
The most honest answer is that a spectrogram image can suggest audio, but it cannot fully become the original audio again. It may be good enough for a texture, a demonstration, or a creative noise bed. It may be surprisingly recognizable when the source is simple. It will struggle with dense mixes, vocals, drums, stereo space, and fine transient detail.
That limitation is not a failure of every converter. It is built into the format shift. Audio became analysis, analysis became pixels, and pixels became a new guess. Once you understand that chain, the tools become less mysterious and more useful. You stop asking them to recover a lost master and start using them for the things they can actually do.